
Stack traces in GHCi, coming in GHC 8.0.1
February 12, 2016tl;dr
In the upcoming GHC 8.0.1 release, if you start GHCi with ghci -fexternal-interpreter -prof (any packages you use must be built for
profiling), then you get access to detailed stack traces for all the
code you load into GHCi. Stack traces can be accessed via assert,
error, Debug.Trace.traceStack, and the API in GHC.Stack.
Background
Haxl users at Facebook do a lot of development and testing inside
GHCi. In fact, we’ve built a customized version of GHCi that runs
code in our Haxl monad by default instead of the IO monad, and has
a handful of extra commands to support common workflows needed by our
developers.
Some of our codebase is pre-compiled, but the code being actively
worked on is just loaded on the fly into GHCi during development and
run with the interpreter. This works surprisingly well even for large
codebases like ours, especially if you enable parallel compilation and
use a bigger heap (e.g. ghci -j8 +RTS -A128m). This is a pretty
smooth setup: right inside GHCi we can test the production code against
real data, and interact with all of the services that our production
systems talk to, while having a nice interactive edit/compile/test
cycle.
However, one thing is missed by many developers, especially those coming from other languages: easy access to a stack trace when debugging. So, towards the end of last year, I set about finding a workable solution that we could deploy to our users without impacting their workflows.
Show me a stack trace!
To cut to the chase, in GHC 8.0.1 you can fire up ghci like this:
$ ghci -fexternal-interpreter -profand you have stack traces on, by default, for all the code you load into ghci. Let’s try an example.
import Control.Exception

myTail xs = assert (not (null xs)) $ tail xs

myMap :: (a -> b) -> [a] -> [b]
myMap f [] = []
myMap f (x:xs) = f x : myMap f xs

main = print (myMap myTail [[3],[]])
We have a map-alike function called myMap, and a tail-alike function
called myTail. We want to find out if myTail is called with an
empty list, so we added an assert. Ok, so it’s a contrived example,
but let’s see what happens:
$ ghci -fexternal-interpreter -prof
GHCi, version 8.1.20160127: http://www.haskell.org/ghc/  :? for help
Prelude> :l ~/scratch/tailtest.hs
[1 of 1] Compiling Main             ( /home/smarlow/scratch/tailtest.hs, interpreted )
Ok, modules loaded: Main.
*Main> main
[[],*** Exception: Assertion failed
CallStack (from ImplicitParams):
  assert, called at /home/smarlow//scratch/tailtest.hs:3:13 in main:Main
  myTail, called at /home/smarlow//scratch/tailtest.hs:9:21 in main:Main
CallStack (from -prof):
  Main.myTail (/home/smarlow/scratch/tailtest.hs:3:13-34)
  Main.myTail (/home/smarlow/scratch/tailtest.hs:3:13-44)
  Main.myMap (/home/smarlow/scratch/tailtest.hs:7:18-20)
  Main.myMap (/home/smarlow/scratch/tailtest.hs:7:18-33)
  Main.main (/home/smarlow/scratch/tailtest.hs:9:15-35)
  Main.main (/home/smarlow/scratch/tailtest.hs:9:8-36)
*Main>
Now, we got two stack traces, both printed by assert. The first
comes from ImplicitParams,
which knows the location of the call site of assert because assert
has a special ?callStack :: CallStack constraint in its type.
The second stack trace is the new one, generated by GHCi running in
-prof mode, and has the full call stack all the way from main,
including the fact that myTail was called by myMap. That is, it’s
a dynamic call stack, not a lexical one.
Dumping the stack from anywhere
Using assert is one way to get access to a stack trace, but
sometimes you just want to print out the stack when a particular
condition is hit, or when a function is called, to see what’s going
on. For this reason we have Debug.Trace.traceStack.
This is like trace, but it also prints out the current stack trace.
For example, I just picked a random place in the code of Happy,
inserted a call to traceStack, loaded Happy into ghci -fexternal-interpreter -prof, ran it and got this:
closure1
CallStack (from -prof):
  LALR.closure1.addItems.fn (LALR.lhs:106:28-48)
  LALR.closure1.addItems.fn (LALR.lhs:(106,28)-(110,84))
  LALR.closure1.addItems.fn (LALR.lhs:(104,40)-(111,31))
  LALR.closure1.addItems.new_new_items (LALR.lhs:100:59-74)
  LALR.closure1.addItems.new_new_items (LALR.lhs:100:37-75)
  LALR.closure1.addItems.new_new_items (LALR.lhs:(99,33)-(101,53))
  GenUtils.mkClosure (GenUtils.lhs:28:28-36)
  GenUtils.mkClosure (GenUtils.lhs:28:20-36)
  LALR.closure1 (LALR.lhs:91:16-67)
  LALR.closure1 (LALR.lhs:91:11-68)
  LALR.genActionTable.possActions (LALR.lhs:489:44-64)
  LALR.genActionTable.possActions (LALR.lhs:(489,33)-(490,60))
  LALR.genActionTable.actionTable (LALR.lhs:471:34-53)
  LALR.genActionTable.actionTable (LALR.lhs:(469,26)-(471,54))
  LALR.genActionTable.actionTable (LALR.lhs:(468,23)-(472,61))
  Main.main2.runParserGen.action (Main.lhs:114:49-77)
  Main.main2.runParserGen.action (Main.lhs:114:27-78)
  Main.main2.runParserGen (Main.lhs:(96,9)-(276,9))
  Main.main2.runParserGen (Main.lhs:(90,9)-(276,10))
  Main.main2.runParserGen (Main.lhs:(86,9)-(276,10))
  Main.main2.runParserGen (Main.lhs:(85,9)-(276,10))
  Main.main2 (Main.lhs:74:20-43)
  Main.main2 (Main.lhs:(64,9)-(78,61))
  Main.main (Main.lhs:57:9-18)
You’ll notice that each function appears on the stack multiple times—this is because the the annotations are based on scopes, and GHC tries to insert annotations in useful-looking places. There might well be room for refinement here in the future.
Any drawbacks?
You have to compile your packages with profiling. Use
--enable-library-profilingwhen running Cabal, or setlibrary-profiling: Truein your.cabal/config, or do the Stack equivalent.Results with calls to
errorare mixed, because theerrorcalls are often lifted to the top level as a CAF, which breaks the stack simulation that the profiler does. I have ideas for some workarounds for this that I plan to try in the future.Interpreted code will run more slowly. But this is only for debugging—we didn’t change the source code, so everything still runs at full speed when compiled normally. You can also pre-compile some of your code; don’t forget to use
-prof, and add-fprof-auto-callsto get stack-trace annotations for the code you compile. You can:set -fobject-code -fprof-auto-callsinside GHCi itself to use compiled code by default.
How does it work?
We’re using the existing stack-simulation that happens in GHC’s profiler, called “cost-centre stacks”. However, running in profiled mode wasn’t supported by the interpreter, and there were some serious shenanigans involved to make it possible to run profiled code in GHCi without slowing down GHCi itself.
There are various differences in the way the Haskell code runs in profiling mode. The layout of heap objects is different, because every heap object points to information about the call stack that created it. This is necessary to get accurate stack simulations in the presence of things like higher-order functions, but it’s also important for the heap profiler, so that it can tell who created each heap object. When running in profiling mode, we have to do various things to maintain the runtime’s simulation of the call stack.
The first step was to make the interpreter itself work in profiling mode (as in, interpret code correctly and not crash). Fortunately this wasn’t nearly as difficult as I’d anticipated: the interpreter and byte-code compiler were already nicely abstracted over the things that change in profiling mode. At this point we can already do things that weren’t possible before: profile GHCi itself, and profile Template Haskell.
Next, I had to make the interpreter actually simulate the call stack for interpreted code. Again, this was reasonably straightforward, and involved using the breakpoints that GHCi already inserts into the interpreted code as SCC annotations for the profiler.
So far so good: this actually worked quite nicely, but there was one huge drawback. To actually use it, we have to compile GHC itself with profiling. Which works, except that it slows down GHCi when compiling code by a factor of 2-3. That was too big a hit to deploy this as part of the standard workflow for our Haxl users at Facebook, so I needed to find a way to make it work without the overhead on the compiler.
Enter Remote GHCi
The solution is to separate the compiler from the interpreter, using a scheme that I’ve called Remote GHCi. The idea is that by putting the compiler and the interpreter in separate processes, the compiler can be running at full speed on a normal non-profiled runtime, while the interpreter is running in a separate process using the profiled runtime.
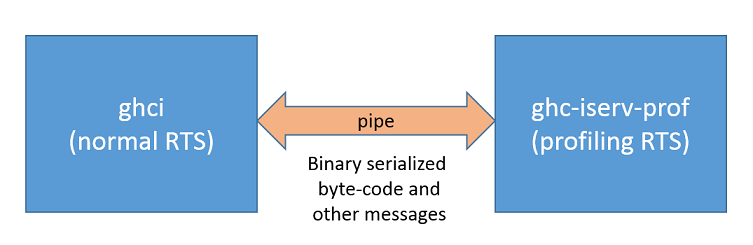
The main complication is arranging that all the interactions between
the compiler and the interpreter happen via serialized messages over a
pipe. We currently have about 50 different message types, you can see
them all here.
We’re currently using the binary library together with Generic
instance generation, but serialization and deserialization using
binary is definitely a bottleneck so I’m looking forward to moving
to the new CBOR-based serialization library when it’s ready.
It turns out that making this separation has a number of advantages aside from stack traces, which are listed on the RemoteGHCi wiki page.
GHCJS has been doing something similar for a while to support Template
Haskell. In fact, I used the GHCJS Template Haskell code as a
starting point, integrated it with GHC proper and built it out to
fully support GHCi (with a couple of exceptions, notably the debugger
doesn’t currently work, and dynCompileExpr in the GHC API cannot be
supported in general).
Remote GHCi also works for Template Haskell and Quasi Quotes, and has
the advantage that when compiling TH code with -prof -fexternal-interpreter, you don’t need to first compile it without
-prof, because we can run the -prof code directly in the external
interpreter process.
Three kinds of stack trace in GHC 8.0.1
There’s a lot happening on the stack trace front. We now have no less than three ways to get a stack trace:
- Profiling:
ghc -prof -fprof-autoandghci -fexternal-interprter -prof - ImplicitParams, with the magic
?callStack :: CallStackconstraint (now calledHasCallStack). - DWARF:
ghc -g
Each of these has advantages and disadvantages, and none of them are subsumed by any of the others (sadly!). I’ll try to summarise:
Profiling
- Detailed, dynamic, call stacks
But:
- Requires recompiling your code, or loading it into GHCi
- 2-3x runtime overhead compiled, 20-40x interpreted
- Not so great for
errorandundefinedright now
ImplicitParams
- Good for finding the call site of particular functions, like
errororundefined
But:
- Requires explicit code changes to propagate the stack
- Some runtime overhead (stacks get constructed and passed around at runtime)
- Shows up in types as
HasCallStackconstraints - Lexical, not dynamic. (In
g = map f,gcallsfrather thanmapcallingf)
Could you change GHC so that it automatically adds
HasCallStackconstraints everywhere and also hides them from the user, to get the effect of full call-stack coverage? Maybe - that would be an alternative to the scheme I’ve implemented on top of profiling. One difficult area is CAFs, though. If a constraint is added to a CAF, then the CAF is re-evaluated each time it is called, which is obviously undesirable. The profiler goes to some lengths to avoid changing the asymptotic cost of things, but trades off some information in the stack simulation in the process, which is why calls toerrorsometimes don’t get accurate call stack information.- Good for finding the call site of particular functions, like
DWARF
- No runtime overhead, can be deployed in production.
- Good when you’re not willing to sacrifice any performance, but having some information is better than none when something goes wrong.
But:
- Gives the raw execution stack, so we lose information due to tail-calls and lazy evaluation.
Conclusion
We now have full stack traces inside GHCi, provided you compile your
packages for profiling, and use ghci -fexternal-interpreter -prof.
Remote GHCi is not the default in GHC 8.0.1, but it’s available with
the flag -fexternal-interpreter. Please try it out and let me know
how you get on!