Optimising Garbage Collection Overhead in Sigma
July 28, 2015Background
I work with a team at Facebook on Sigma, which is part of the anti-spam infrastructure. Sigma runs Haskell code, using the Haxl framework.
I plan to use this blog to post about things that our team is doing that relate to Haskell and might be of interest to the wider Haskell community. When I say “we” in what follows, I’m referring to the team that works on Haxl and Sigma at Facebook.
Profiling the GC
Last week I decided to dig into how the Haskell GC was performing in Sigma. Up until now we’ve been mostly focusing on performance of the Haskell code, because reducing allocation pressure by optimising the Haskell code has direct benefits in reducing GC overhead. We had made a couple of improvements to the GC itself (here and here) earlier, but until now we hadn’t done a thorough investigation into how the GC was behaving.
It turns out there was some low-hanging fruit, and I managed to cut the GC overhead roughly in half for our production workload with a handful of fixes (by me and others). This is performance for free—the Haskell code remains the same, but running it consumes less time and electricity.
Goals
A couple of things prompted this investigation:
Sigma runs on different types of machines, with different numbers of cores. On machines with more cores, we were seeing longer GC pause times.
A no-brainer way to reduce GC overhead is to give the GC more memory. Every time the GC runs, it has to traverse all the live data, so it follows that running the GC half as often should yield half the overhead. Running the GC half as often requires twice as much memory. Unfortunately I found that while this works to some extent, using more memory unexpectedly also resulted in longer pause times.
Longer pause times are a problem when you care about latency, so this artificially constrains the amount of memory Sigma can use while staying within its latency requirements.
There are a couple of solutions to this problem I’m going to ignore for now:
GC architecture that is designed to reduce pause times, such as concurrent or incremental GC. Indeed I worked on a partially-concurrent GC for GHC, but it currently isn’t part of GHC for various reasons (too complicated, moves overheads to other places, etc.). In the future I’d like to return to this, but for now let’s ignore alternative GC architecture and see what can be done with the existing stop-the-world parallel GC.
There are load-balancing tricks that could be used to avoid sending requests to machines about to GC. This could be important if your latency requirements are tighter than typical GC pause times would allow, but at least in our case there is enough headroom that we don’t need to worry about this. So again, let’s ignore load-balancing tricks and just worry about how to reduce pause times.
Start with a ThreadScope profile
The first thing I did was to break out ThreadScope and visualize a Sigma process running flat out (note that running flat out is rare in practice, because traffic isn’t constant, and it’s important to have spare capacity just in case).
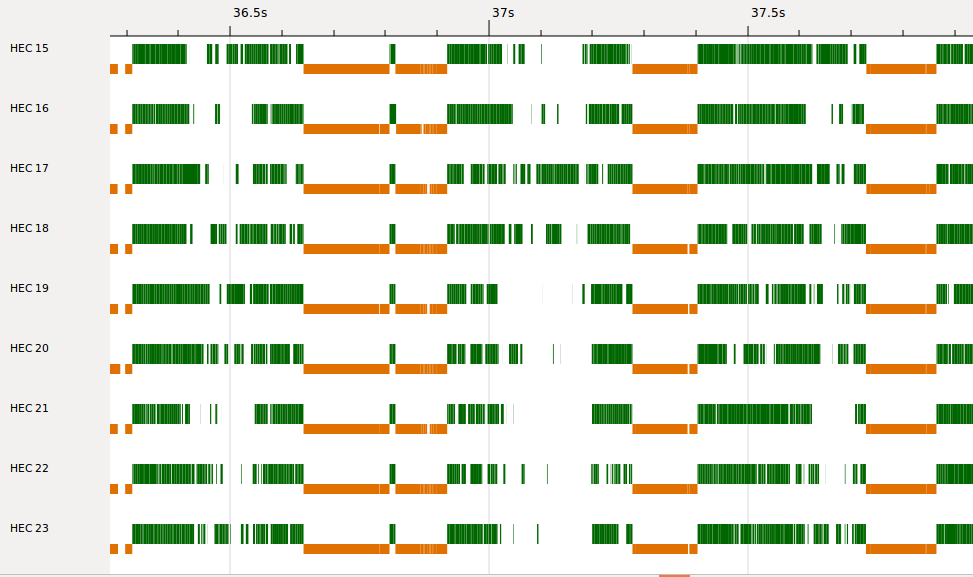
ThreadScope immediately threw up a few interesting things to investigate. First, it looks like some of the cores are only partially active:

This is only showing activity in Haskell, not in C++, so it doesn’t necessarily mean the machine wasn’t busy during those times. However, it could also be that GHC’s scheduler isn’t doing a great job of balancing the load. That definitely deserves investigation, but I’m primarily interested in what the GC is doing, so let’s come back to that later (in a future post, perhaps).
Right off the bat: a bug in GC synchronisation
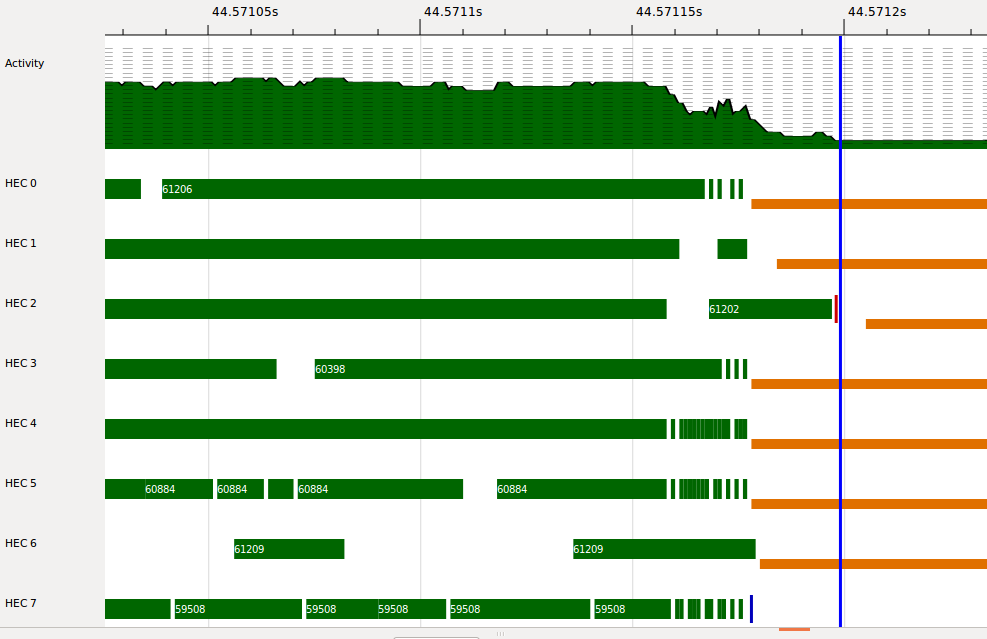
Let’s look at a typical GC:

When a GC is required, all the cores stop running Haskell code and report for GC duties. When they stop, they have to synchronise. In the above profile a few cores appear to “stutter” a bit before stopping. This turned out to be a bug in the scheduler that was a bit tricky to track down, but wasn’t hard to fix. It won’t affect most people using GHC because it only happens when using the “nursery chunks” feature we added earlier.
GC phases
There are a few phases in a GC. ThreadScope doesn’t show them all visually, but they can be identified from the raw event log data:
Synchronisation: as described above. We know from monitoring that this typically takes about 1ms, so compared to our overall GC pause time it’s not significant. Incidentally, to get the sync time down to a sensible value we had to do a lot of work to identify FFI calls that should be marked “safe” rather than “unsafe”.
Init: one thread sets up the GC data structures ready for GC
Trace: all the threads trace the live data and copy it
Cleanup: one thread tidies up the GC data structures and releases memory.
Trace is the biggest phase, as expected (I’ll come back to that later). But Init and Cleanup are both single-threaded phases, so it’s especially important to keep these phases short. Looking at the ThreadScope profile, it looks like the Init phase is about 5ms, while Cleanup is regularly 20ms or greater - now that is surprising, I’d really like to know where that 20ms is going.
Next I instrumented the Cleanup phase to narrow down where the time is going. I found that:
Between 1-10ms is spent releasing memory for large objects. This is surprising, and goes some way to explaining why larger heap sizes result in longer pause times. Needs more investigation (in a later post).
20ms is spent in
zero_static_object_list(), I’ll come back to this later.5ms is spent finalizing objects. Wow! I didn’t realise there was anything that needed finalizing at all.
Saving 5ms per GC by not using ForeignPtr
With a bit more instrumentation (which is a fancy name for printf),
I discovered that each GC was finalizing around 20,000 weak pointers.
A weak pointer is created by newForeignPtr in Haskell - it’s a
pointer to a data structure outside the Haskell heap that needs to be
finalized when it becomes garbage. These things are quite
heavyweight, due to the extra work the GC needs to do to track them.
It took me a little while to find exactly what was creating these
ForeignPtrs, but eventually I tracked it down to the regex-pcre
package. Some of our Haskell code uses regular expressions, and
compiling a regex using regex-pcre creates a ForeignPtr.
This is perfectly reasonable when the library doesn’t know the lifetime of the regex, and it’s typically a good idea to compile a regex once and use it many times. But the places that were using regexes, the regex was compiled once and then discarded.
It was simple enough to change the regex-pcre to expose a
withRegex function that used scoped allocation rather than
ForeignPtr, and then use this. This removed all the ForeignPtrs
and saved 5ms per GC.
Saving 20ms per GC by optimising static object handling
The next thing to look at was zero_static_object_list(). The story
behind this is a bit involved. In Haskell we can have top-level lazy
definitions; when you write something like this
x :: HashMap Text Int
x = HashMap.fromList [ ("a",1), ("b",2), ... ]
x is a top-level definition that is computed when it is first used.
This is called a CAF (Constant Applicative Form).
Now, the garbage collector needs to know about all the CAFs, because
they are roots into the heap. However, it is important to
garbage-collect a CAF that is no longer needed, because it might be
holding onto a lot of data in the heap. But to tell when x is no
longer needed, the GC needs to follow references from code, not just
data. So that’s what the GC does - there’s an abstraction of the
references from code, called an SRT (Static Reference Table), and the
GC traces all the CAFs reachable from the SRTs during every major GC.
During this process, the GC links all the static objects, like x,
together on a list, so it can tell which ones it has seen so far. The
list is chained through the objects themselves - each one has a link
field that starts NULL and points to the next object on the list when
it has been visited. After GC, the fields must be reset to NULL
again, which is what zero_static_object_list() is doing. In Sigma
there is a lot of code, so this was taking 20ms.
The trick to avoid this is instead of using NULL to indicate an object that the GC hasn’t seen yet, use a flag that flips between two states. I use the values 1 and 2, and store these in the low 2 bits of the pointer in the object’s link field. Each GC flips the flag value to the other state and stores it in each object it visits. If the GC meets an object with the other flag value, we know we haven’t seen it during this GC cycle. The scheme is made a little more complicated by two other things: there might be objects that appear that we have never seen before (due to runtime linking), and there might be objects that are unconditionally alive for other reasons (which is what the values 0 and 3 are reserved for).
Here’s the patch. At the time of writing, I had to back it out because it introduced a performance regression in one benchmark, and some test failures in a certain build configuration. I’ll investigate those and get the patch back in as soon as possible.
Avoiding contention by optimising HEAP_ALLOCED()
ThreadScope doesn’t give an indication of where in the code the time
is being spent, so I also took a look at the output from the Linux
perf tool for our running process.
It showed that the process was spending a lot of time in evacuate,
which is not surprising - that’s the routine in the GC that copies
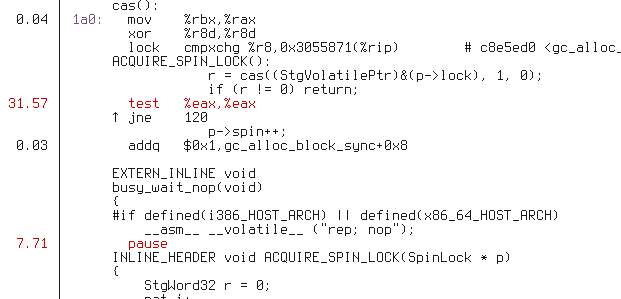
objects. However, when I drilled down into evacuate in perf report and annotated the assembly, this is what I saw:

The majority of the time is spent in a spinlock. Furthermore, it
tells which one: this is part of the implementation of a function
called HEAP_ALLOCED().
A bit of background is in order. GHC allocates memory from the
operating system in units of aligned megabytes. So it owns a
collection of megabytes that might be anywhere in the address space.
For every pointer it sees, the GC asks the question “is this a pointer
into the heap?”, and the memory manager should return true for any of
the memory that GHC has allocated, and false otherwise. This is the
job of the HEAP_ALLOCED() macro.
On a 32-bit machine, answering the question is easy: a megabyte is 20 bits, so we only need a 12-bit lookup table, and even using a full byte for each entry, that’s just 4KB.
On a 64-bit machine, it’s much harder. Even taking advantage of the fact that only 48 bits are available address space on x86_64 architecture machines, that still leaves 28 bits, which is a 256MB table (32MB using bits instead of bytes). This is not likely to be an acceptable memory overhead.
So the existing implementation of HEAP_ALLOCED() for 64-bit machines
used
a cache. The fallback path for a cache miss needs to consult the actual memory mapping, which requires a lock.
In our application, which has quite large memory requirements and uses a lot of cores, there were a lot of cache misses, and contention for this lock was extremely high.
Fortunately, a solution to this problem had been sitting around for a while, in the form of the two-step allocator (the patch is by Giovanni Campagna, with a few updates by me). Instead of allocating memory randomly around the address space, the runtime reserves a large chunk of address space up front, and then allocates memory within that chunk. This works on certain OSs - Linux and OS X, but not Windows, it turns out.
Bringing in this patch made a huge difference to GC performance, although it’s difficult to get an accurate measure of how much, because the amount of contention for the lock in the old code depended on the random location of memory in the address space. In total the patches mentioned so far approximately halved GC overhead for our workload.
Loose ends
There were a couple of loose ends to chase up from the ThreadScope profile: possible scheduler suboptimality, and time spent freeing large objects. I plan to look into those later, there may well be further improvements to be had. Until next time!
